

Wind Power
Abstract
Currently, wind energy represents 8.1% of the total in the energy matrix in Brazil. In the Brazilian Northeast, wind enery represents 45.37% of the total. The problem of wind energy is that it is an intermittent energy so it is not available when you need what you need, this makes it necessary to carry out an exhaustive analysis of how much energy the wind turbines are going to produce at any given time. to know if there will be an excess of energy or if it will be necessary to resort to another source of energy to supply the energy expenditure.
In this project I obtained wind data from one of the capitals of the Brazilian northeast to make a statistical study of their behavior. I made a calculation with different wind turbines and developed a machine learning model to calculate the energy produced by wind turbines only by entering the wind data. Once all this was calculated I obtained the data of the consumption of this city during the previous 10 years and compare the energy generation of these wind turbines to see how many times exceeded energy and how many were missing.
Exploratory data analysis
The wind data were supplied by the University of São Paulo, the data contained the wind speed with an interval of one hour in each record of the year 2008 until the year 2018. The height at which this data was taken was 10 meters.
This data was taken automatically by an anemometer so many of the records contained errors. It was supplied to me through two text files, so I first opened these two files and examined them separately. These data contained the wind speed, the address, the date and the time at which they were recorded.
The analysis was done in Python, I read the .txt file and began to delete the null values and incorrect values, such as negative wind speeds and wind directions above 360º. Once verified that the data were clean I performed an exploratory analysis of the data, eliminating the outliers since there were data that exceeded more than 20 meters per second, which is very difficult to occur. I interpreted them as atypical values and eliminated them, thus leaving the values with a value greater or less than 3 times the z score.
Once the data was left without outliers, I proceeded to perform basic statistics calculations such as the mean and the median for each year. Once these parameters are calculated I calculate the Weibull parameters, the statistical calculation used to obtain the wind power density.

Wind Characteristics
Machine Learning model
Once the wind characteristics were obtained, I wanted to automate the process of calculating the energy that a wind turbine could generate. First I gathered the information of which are the most used wind turbines in Brazil and I did a search of their characteristics, obtaning the following table:

Wind Turbine Characteristics
With the characteristics of the wind turbines, I calculated how much energy could be obtained from a wind turbine in a given time. The following table shows the amount of energy that would generate each of the wind turbines in the city of strength in the period of one year:

Wind Turbine Production
The model V136 / 3450 is the model that best adapts to the wind of strength producing more energy than the rest on average. Now that I know which wind turbine I will use, I also know how high I have to extrapolate the speed of the wind, so only knowing the temperature, average pressure and relative humidity can I create a machine learning algorithm that calculates how much that aerogerator will generate.
For this model I used the meteorological data of the city of strength for 10 years provided by the Cereal Foundation of Meteorology FUNCEME. With these data I apply different formulas to be able to calculate these variables at the desired height and apply several algorithms of machine learning regression together with an artificial neural network. I created these models with the Scikit-Learn library and for the artificial neural network with the Keras library, obtaining the following results:
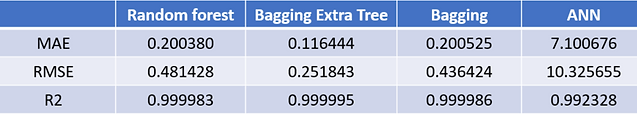
Errors of Machine Learning models
It can be observed from the table as the bagging method using as ExtraTree Hyperparameter regressor works better than the other algorithms. The neural network has a fairly large error, this could be improved by putting more hidden and more nervy layers in each layer, but I could not do it because of the low capacity of my computer.
Comparison of energy produced and energy consumed
With everything calculated in the previous sections I can calculate how much energy a wind turbine can generate given some meteorological variables.
The Brazilian national electric system operator (ONS) makes energy consumption available for all cities in Brazil. I downloaded the data in csv and introduced it in Python. These data have the same format as the wind speed since they are recorded in intervals of each hour which allows me to make a direct comparison.
Once the calculation of how much the wind turbine generated above was generated, I made a comparison obtaining the following results:
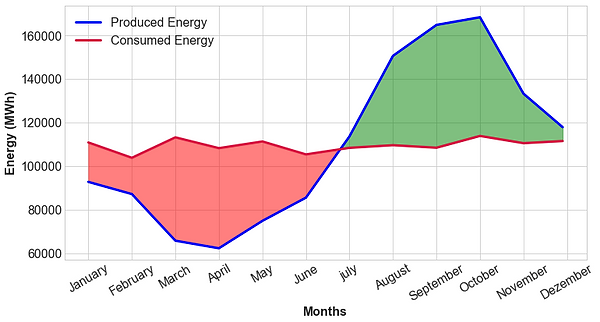
Energy Produced vs Energy Consumed by month
As can be seen in the image, on average between the months of January and June there is a loss of energy and for the other months there is an excess of energy. But this is on average per month, which does not mean that in the month of January there are no times of the day that this energy is exceeded.
To show this more clearly I made a similar calculation to compare the hours of the day, shown below, with which you can see how at different times of the day the energy is exceeded and lost

Energy Produced vs Energy Consumed by hour
As shown in the graphics there are months that are lost more than generated, but depending on the time of day you need energy from another source or you are exceeding energy, so a detailed analysis of each hour of the day for all the days of the Year has to be done. I made this calculation by means of python where I obtained the following results:
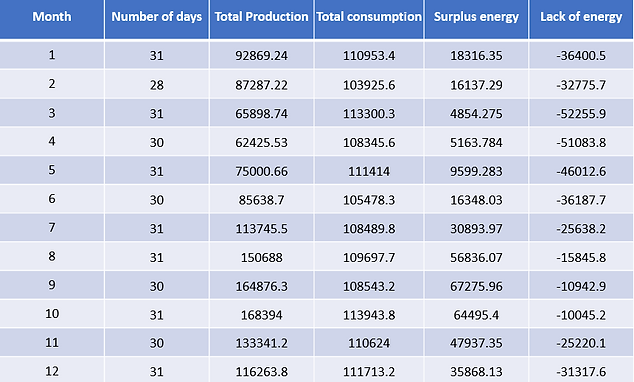
Energy Produced vs Energy Consumed final result


