Google Stock Price
Description
I will make a LSTM neural network that will try to capture the downward and upward of the google stock price, because LSTM is the most powerful model that can do this.
This LSTM it's going to be robust, with several layers, it's going to be a stacked LSTM were I am going to add some dropout regularization to avoid overfiting and use the most powerful optmizer that Keras library has
For that I am going to train the LSTM model on five years of the google stock price and this is from the beginning of 2012 to the end of 2016 and then based on this training, based on the correlations idenified or capured by the lstm of the google stock price I will try to predict the first month of 2017.
LSTM
Long Short Term Memory networks – usually just called “LSTMs” – are a special kind of RNN, capable of learning long-term dependencies. They were introduced by Hochreiter & Schmidhuber (1997). They work tremendously well on a large variety of problems, and are now widely used.
LSTMs are explicitly designed to avoid the long-term dependency problem. Remembering information for long periods of time is practically their default behavior, not something they struggle to learn. All recurrent neural networks have the form of a chain of repeating modules of neural network. In standard RNNs, this repeating module will have a very simple structure, such as a single tanh layer.
Google Stock Price
Data preprocessing
The LSTM model will only be trained with one column, open variable as you can see in the graph shown above, this variable shows the value of google stock price at the beginning of each day.
It will be necessary to perform a scaling feature in the dependent variable, it is recommended standardization for the LSTM because of the sigmoid function that this type of neural network uses, I will do it using the MinMaxScaler function of scikit-learn library.
A special data structure has to be created with 60 timesteps and one ouput. 60 timesteps means hat at each time T the RNN is going to look at the 60 stock prices before time T and based on the trends it is capturing during these 60 previous timesteps it will try to predict the next output. 60 is a number that I experimented, tried different number of time steps, first 20 times, which was not enough to capture some trends, then 30, 40 and eventually the best number of timesteps I ended up with was 60, which corresponded to three months .
The chart below shows the predicted trends obtained by the trained neural network once the 5 years of google stock price have been introduced into the model.
Predicted Vs. Real google stock prices
Building the RNN


LSTMs also have this chain like structure, but the repeating module has a different structure. Instead of having a single neural network layer, there are four, interacting in a very special way.
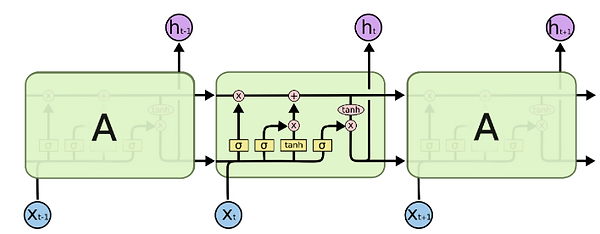
The LSTM does have the ability to remove or add information to the cell state, carefully regulated by structures called gates.
Gates are a way to optionally let information through. They are composed out of a sigmoid neural net layer and a pointwise multiplication operation.
The sigmoid layer outputs numbers between zero and one, describing how much of each component should be let through. A value of zero means “let nothing through,” while a value of one means “let everything through!”
An LSTM has three of these gates, to protect and control the cell state.
The recurrent neural network that I have built has 4 LSTM layers and a last layer as a unit without any activation function since the result is a regression. The hyper parameters used for these four layers have been:
-
Units = 50
-
Return sequences = True
-
Dropout 20%
Once the four LSTM layers have been defined I have chosen to compile this neural network the following hyperparameters:
-
Optimizer = adam
-
Loss = mean_squared_error
-
Epochs: 100
-
Batch size: 32
Visualising the results
